

Bitcoin demand in October:
• Public companies bought more after a weak summer
• Spot ETFs saw net outflows
• Corporate buying covered part of the gap, not all of it https://t.co/p2EOQ5Rto4


Quantitative macro research and visual data tracking Bitcoin, ETF flows, and interest rates
Ecoinometrics is a quantitative market research platform and newsletter focused on digital assets and macroeconomics. It analyzes Bitcoin, spot Bitcoin exchange-traded funds, and traditional financial metrics through chart-based research, tracking how liquidity, inflation indicators, and central bank decisions shape crypto market dynamics.
The platform evaluates digital asset markets through a traditional finance lens. Its analysis covers institutional demand via spot Bitcoin ETF net flows, corporate treasury strategies like MicroStrategy's accumulation patterns, and relationships between digital assets and other markets. Coverage also extends to central bank policy and liquidity benchmarks such as the National Financial Conditions Index (NFCI).
Ecoinometrics distributes research through regular updates and charts. Alongside written reports, the site provides an interactive dollar-cost averaging (DCA) calculator built on 100 years of historical market data.
The ecoinometrics.com domain was registered in May 2019. The project publishes commentary on its website and social channels, including updates on FOMC sentiment scoring and ETF flows. In October 2026, its posts covered ETF flows and the 10-year Treasury yield.
The service does not connect to user wallets or manage funds, so users face no custodial risks. Core analysis centers primarily on Bitcoin and major macroeconomic aggregates rather than broad altcoin ecosystems.
Ecoinometrics offers focused Bitcoin and macroeconomic research with useful charts, but it is not a wallet-connected portfolio tracker.
Ecoinometrics is a web-based research publication rather than a conventional portfolio tracker. Its main subjects are Bitcoin, ETF flows, macroeconomic conditions, inflation, interest rates and MicroStrategy. Recent analysis covers ETF demand, Treasury yields and Federal Reserve policy, while the site also includes a dollar-cost-averaging calculator built from 100 years of historical market data.
The publication covers Bitcoin macroeconomic metrics and ETF holdings alongside corporate Bitcoin purchases. Registered in 2019, the domain maintains an archive of older material and continued to publish dated market commentary in October 2026.
Ecoinometrics is a publication and calculator, not a wallet-connected dashboard.
Ecoinometrics provides Bitcoin commentary and a DCA calculator instead of live portfolio tracking or wallet connections. Older site sections include pieces last updated in May 2024, whereas new market analysis runs through October 2026.
| Tool type | Research, Market data · unverified |
|---|---|
| Free plan | Yes · unverified |
| Wallet tracking | No · unverified |
| NFT data | No · unverified |
Not disclosed by the provider: Paid plans from (per month), Chains covered, API access, Alerts, Mobile app, CSV export.
Data from the provider's website and public sources. Fees and availability change; confirm on the official site before you sign up.
Tracks daily net inflows and outflows across US spot Bitcoin ETFs, analyzing institutional absorption trends alongside price levels.
Monitors macroeconomic metrics including Treasury yields, inflation figures, and the National Financial Conditions Index relative to crypto performance.
Simulates multi-year accumulation strategies using an interactive tool based on 100 years of historical market data.
Evaluates corporate crypto treasury holdings, tracking asset purchases for firms like MicroStrategy.
Analyzes and scores FOMC statements and central bank communication to measure monetary policy shifts over consecutive meetings.
This section analyses financial conditions, inflation, interest rates, the yield curve and recession indicators. Articles connect those measures with Bitcoin and broader investment conditions.
This section covers Bitcoin ETF holdings and flows, Bitcoin market conditions, its relationship with Ethereum and the effect of macroeconomic trends on demand.
This section examines inflation across countries and the effect of changing prices on investment decisions. Articles include comparisons involving consumer products and inflation-adjusted prices.
Featured content includes the dollar-cost-averaging calculator and explainers on investing, inflation and recession indicators.
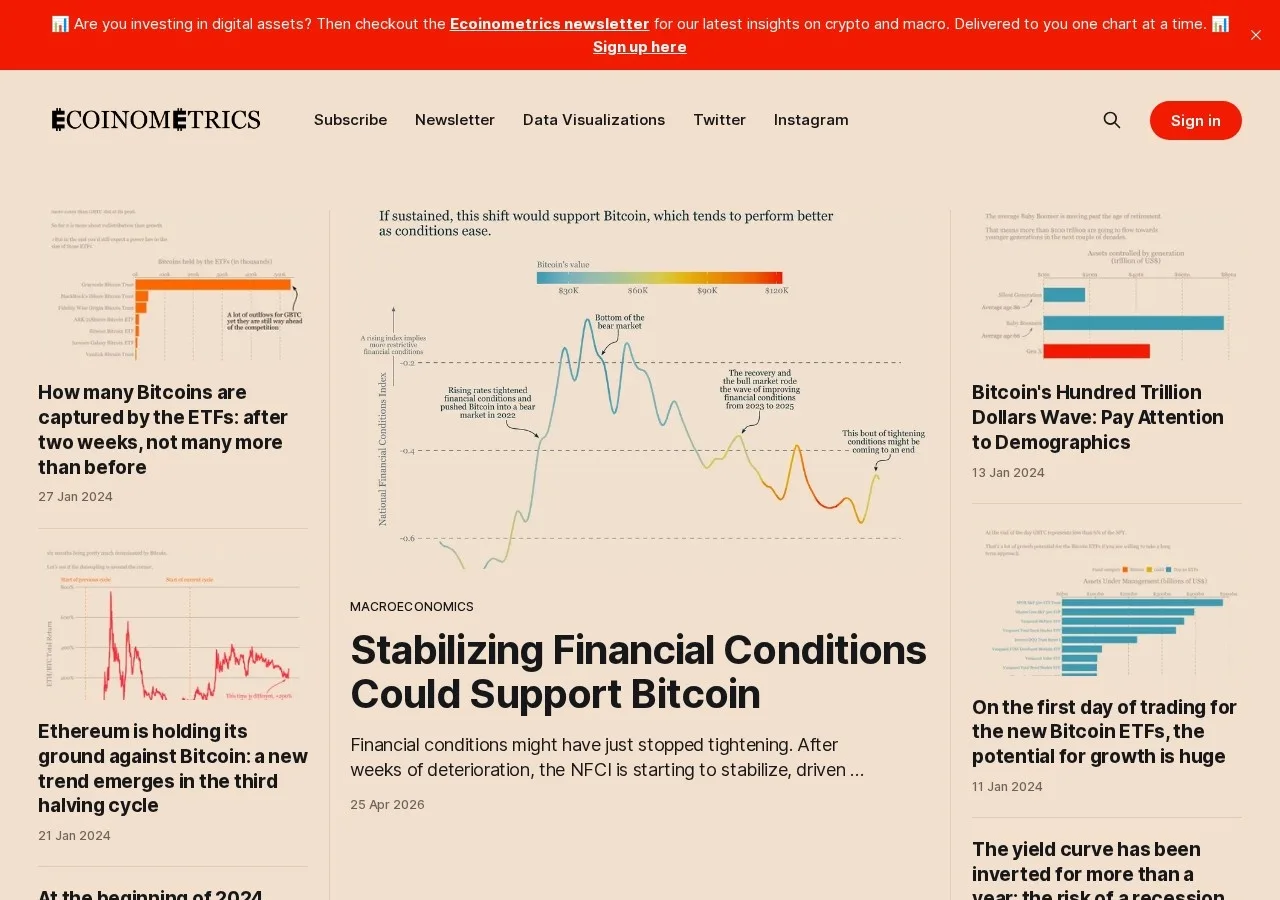
The Latest section lists current research and chart-based analysis. Recent entries cover US debt interest, Federal Reserve rate expectations and Coinbase's connection to Bitcoin ETF custody.
No user reviews yet. Have you used Ecoinometrics? Share your experience below.
Ecoinometrics is a digital asset research publication and newsletter focused on Bitcoin, ETF flows, market structure and macroeconomic conditions. It also offers a dollar-cost-averaging calculator based on 100 years of historical data.
Ecoinometrics is available on the web through ecoinometrics.com. Its products are the research publication, newsletter and DCA calculator.
Ecoinometrics is presented as a research publication and calculator, not as a wallet-connected portfolio tracker. Its published topics include Bitcoin charts, ETF demand and macroeconomic indicators.
Ecoinometrics covers Bitcoin, Bitcoin ETF flows, MicroStrategy holdings and macroeconomic measures such as inflation and interest rates. Recent analysis also discusses Treasury yields and Federal Reserve policy.
Yes. The DCA calculator simulates dollar-cost-averaging strategies using 100 years of historical market data.


Recent public posts from @ecoinometrics, shown as published. Not reviewed or endorsed by CryptoReview.
Open-source DeFi dashboard tracking TVL, fees, and yields across hundreds of chains
Real-time DEX charting and screening platform tracking token pools across more than 60 blockchains
Independent crypto market data aggregator tracking over 22,000 tokens across 360+ networks since 2014
Crypto market analytics and price aggregator tracking over 64 million digital assets since 2013
Ethereum block explorer and multichain indexing API covering over 60 networks
Market charts and research used by 100M+ traders, with a $0 Basic plan
Type at least two characters. Press ↵ to see all results.